How to Read Scratch-Off Odds Before You Buy a Ticket
6/29/2026
By Doug Moeller | Professional Gambler & Founder of Savvy Scratch
Walk up to the lottery counter at any gas station and you will see two or three dozen scratch-off games hanging behind the glass. Every one of them looks like a fair shot. The prices are printed, the odds are listed on the back, the artwork is bright. Almost nobody buying those tickets knows that some of the games were stripped of their best prizes months ago, and the rack keeps selling them at full price anyway.
I spent the better part of fifteen years making a living off games of chance. Poker mostly, blackjack as a card counter, and a handful of casino advantage plays that closed up the moment the casinos noticed them. North of half a million dollars in lifetime winnings, none of it from luck. So when I started looking at scratch-offs, I did not see a game of pure chance. I saw something that behaves a lot more like a blackjack shoe than the lottery wants you thinking about.
That one idea is the whole difference between buying a ticket with a real shot at its top prize and buying a husk that can only pay you back five dollars. Here is how to tell which is which, using nothing but public data the state already publishes.
Want the shortcut version first? You can open a free Savvy Scratch account and see which games to avoid in your state right now, no card required. Start here.
Scratch-offs are not random the way you think they are
The lottery draws you see on television reset every time. Powerball drops every ball back in the hopper after each drawing, so the odds on Tuesday are identical to the odds on Friday. Scratch-offs do not work that way, and this is the part that changes everything.
Each scratch-off game is a closed print run. Say a state prints a few million tickets and loads them with a handful of top prizes, some mid-tier prizes, and a wall of small consolation wins. All of that is locked in at the print plant and shipped to stores. From the day the game launches, every prize that gets claimed is one less prize left in the unsold tickets, but the losing tickets keep coming out of the pack at the same rate. The game slowly drifts away from the odds printed on the back, and nothing on the ticket tells you how far it has drifted. This is what mathematicians call a dependent game, and if you want the deeper version of the math, I broke it all the way down in the complete guide to lottery analysis.
This is the exact situation a card counter lives in. In blackjack, the deck does not reshuffle after every hand. As the small cards get dealt out and the big cards stay in the shoe, the math quietly tilts toward the player. When the big cards leave first, it tilts against him. The counter's entire job is to know which of those two situations he is sitting in, because the same cards and the same rules can be a good bet at one moment and a terrible one ten minutes later. A scratch-off game is the same shoe. The lottery just keeps dealing from it long after the aces are gone, and never posts the count.
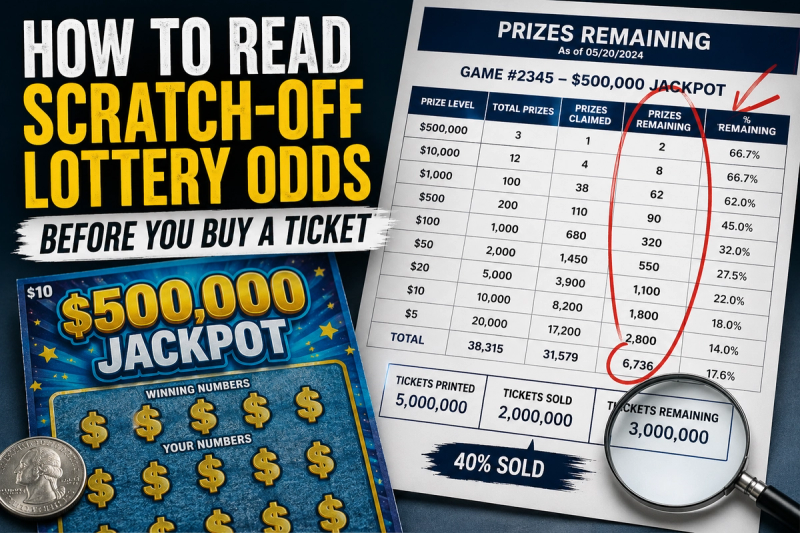
The three numbers that tell you everything
Strip away the noise and there are only three numbers that matter for any scratch-off game. Learn to read them and you can rank every ticket in your state without an app or a spreadsheet.
The first is total tickets, the size of the print run. A game with a few million tickets behaves very differently from one with tens of millions, even if the top prize is identical. Smaller runs burn through their prize structure faster and drift away from the printed odds sooner. This number does not decide anything on its own, but it sets the scale for everything else.
The second is tickets remaining. Subtract the tickets already sold from the print run, and you know roughly how mature the game is. By itself this still does not tell you whether to play, because a game that is ninety percent sold could be a corpse or could be hiding most of its top prizes in those last tickets. Tickets remaining is the denominator. It only becomes useful when you pair it with the third number.
The third number is the one almost no recreational player ever looks at, and it is the whole game. It is prizes remaining, broken out by tier. Every prize level has a current count. How many top prizes are left, how many mid-tier prizes are left. Compare those remaining counts against what the game originally printed, then compare that against how far into the print run you are. That comparison is the entire edge. If a game is forty percent sold and half its top prizes are still out there, you are looking at a slightly above-average bet. If a game is forty percent sold and only a tenth of the top prizes remain, the ticket in front of you is a shell of the game that was advertised. Same price, same artwork, completely different bet. I walked through exactly how to read that mismatch in what the data tells you about your odds, and it is the single skill that separates players who win sometimes from players who buy blind.
Where to actually find this data
None of this is insider information. Every state lottery commission is required to publish prize-remaining data, and it is sitting on their website right now. You are looking for the prize structure or remaining-prizes page for each active game. It will list the total number of each prize printed, how many have been claimed, and how many are left. Some states update it daily, some weekly, a few quarterly.
The catch is presentation. This data is usually buried in PDFs and tables built by someone whose web budget got cut three times during the project. I have spent plenty of nights pulling those reports apart by hand. The information is all there. It is just designed to make you close the tab. If you want to see what turning that raw data into a current-odds read actually looks like, I covered the mechanics in the odds calculator post. The point is that the comparison is doable by hand. It is just slow, and the numbers move, so you would be doing it again next week.
Tired of digging through state PDFs? See the current odds on every active game in your state in about thirty seconds. Check your state on Savvy Scratch.
Live, dying, and dead
Once you can read those numbers, every game collapses into one of three buckets.
A live game still has most of its top prizes in the unsold inventory relative to where it sits in the print run. The odds you see on the back are roughly the odds you are getting, sometimes a little better. These are the games worth playing if you are going to play at all. Some of the best ones are quietly sitting in plain sight, older games the crowd moved on from while the top prizes never got hit, which is the whole idea behind jackpot hunting.
A dying game is where most players get hurt, because it looks completely normal at the counter. The art is the same, the price is the same, the back of the ticket still claims the same overall odds. But the top prizes were claimed months ago and what is left in the pack leans heavily on small consolation wins. You will still hit the occasional ten or twenty dollar winner. You will not hit the prize that pulled you in, because it is already gone.
A dead game has had nearly all of its meaningful prizes claimed. The remaining inventory is essentially a pile of refund tickets dressed up as a real game. The state has not pulled it from the rack because it still collects revenue on every copy sold, and from their point of view that is the whole purpose of the program. Walking past dead games is the easiest money you will ever make, even though you never see it hit your account. The reward is the bankroll that is still there at the end of the month because you spent it on the live game two racks over.
The mistakes that quietly cost more than the games do
Reading the data is the offense. Avoiding self-inflicted leaks is the defense, and the leaks cost regular players more than the games themselves.
The worst one is chasing. After a string of losing tickets, you feel owed something, so you keep buying to get back to even. Card players have a name for that state. We call it tilt, and every professional gambler has lost more money to it than to bad luck. Tilt is the moment emotion takes the wheel away from strategy. You make the bet you swore you would not make, you play the session you should never have started, you buy the fourth ticket because the first three lost. The tickets do not know you are losing, and the prize distribution in the pack does not change because your last few were duds. The single most valuable discipline in this entire game is the willingness to walk out of a store empty-handed and come back tomorrow.
The quieter leaks are loyalty and artwork. Players keep buying the same game for months after the data turned against it, the way you keep going back to a restaurant long after the chef left. And the lottery's art department is very good at its job, which means the deadest game on the rack can carry the most exciting photo. Train yourself to check the numbers first and look at the picture second. If you want the field-tested shortlist of these habits, I laid out five of them here. And once you have actually bought the ticket, do not throw away the value you already paid for. Plenty of states attach second chance drawings to losing tickets, and most players toss them straight in the trash.
You can do all of this yourself
Everything above is real, it is free, and you can run it manually. Pull up your state lottery website, find the prize-remaining reports, compare the top tiers against where each game sits in its print run, and sort the live games from the dead ones. It works.
It also takes an evening with a calculator the first time, and the data shifts, so you would be doing it again next week. Most people are not going to spend their nights reverse-engineering lottery PDFs. I was, which is why I eventually built Savvy Scratch to do it for me. It pulls the prize-remaining data from your state lottery daily, runs the comparison between current odds and the printed odds for every active game, and sorts them into clear buckets across 21 states. The work that used to take me an evening now takes about thirty seconds in line at the gas station.
Either way, before you buy your next scratch-off, take ten seconds to ask whether you are buying it because a photo caught your eye or because you actually checked that the game is still alive. That one question is the whole thing.
See the current odds on every game in your state. Savvy Scratch is $5/month or $50/year, with a 30-day worry-free guarantee. Get started at savvyscratch.com/register.
About the Author: Doug Moeller is a professional gambler with over fifteen years of experience in poker, blackjack card counting, and casino advantage play, with over $500K in lifetime winnings. He built Savvy Scratch to bring the same data-driven approach that works at casino tables to scratch-off lottery tickets. Follow Doug on X | YouTube